Conclusion
In his book284 Shewhart, W.A., Statistical Method from the Viewpoint of Quality Control, The Department of Agriculture, 1939. published in 1939—the era when statistics and mass production found each other—Walter A. Shewhart wrote, “In any case … an observed sequence is or is not random can be verified only in the future.” The sequence of observations shown in Figure 38 in Chapter 3 must have puzzled many in his time, and we know it was a time of chaos. The data without being looked at by a model is like a mountain in the Cascade Range that has not been named. Why, according to Ayn Rand, do the machines have their moral code“Every part of the motors was an embodied answer to ‘Why?’ and ‘What for?’”285 Rand, A., Atlas Shrugged, Random House, 1957.. Not surprisingly, but still conceptually challenging even nowadays for newcomers to accept his idea, Walter A. Shewhart created the concept of a control chart to frame the sequence of observations in Figure 38. His brilliant and bold idea is shown in Figure 39.
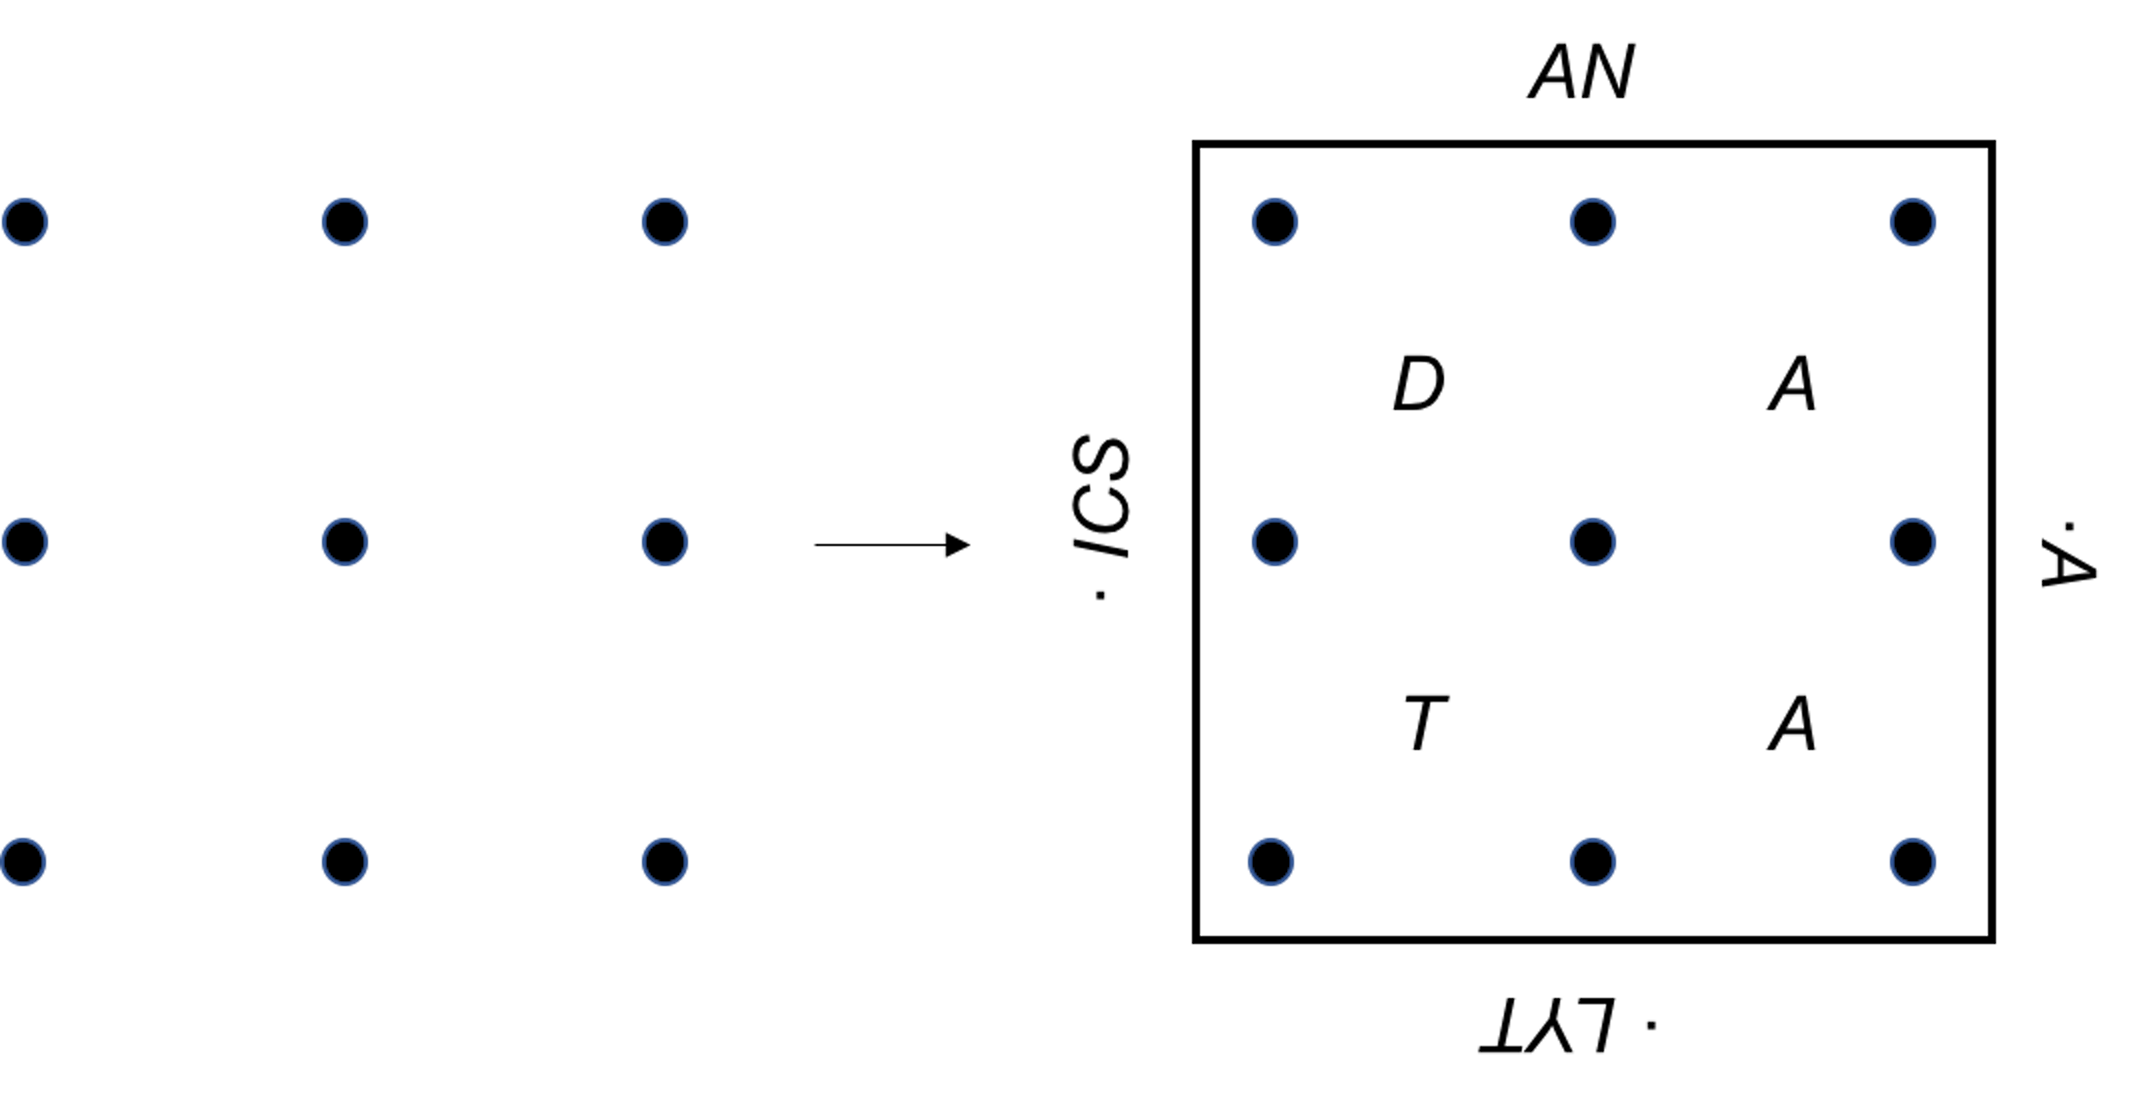
We are still doing the same thing Shewhart had done to create a frame and look at the data within the frame, as Figure 197 shows.
Sometimes, we even love the frame more than the picture. But any valuable effort in practice must meet a specific goal, and how the frame can help us reach the goal is the first step to exercise our knowledge, willpower, and judgment. So, without further rambling, we invite you to answer this question: how do you connect the \(9\) points in Figure 197 with \(4\) lines?
Figure 197: (Left) the data; (right) the data being looked at within a frame

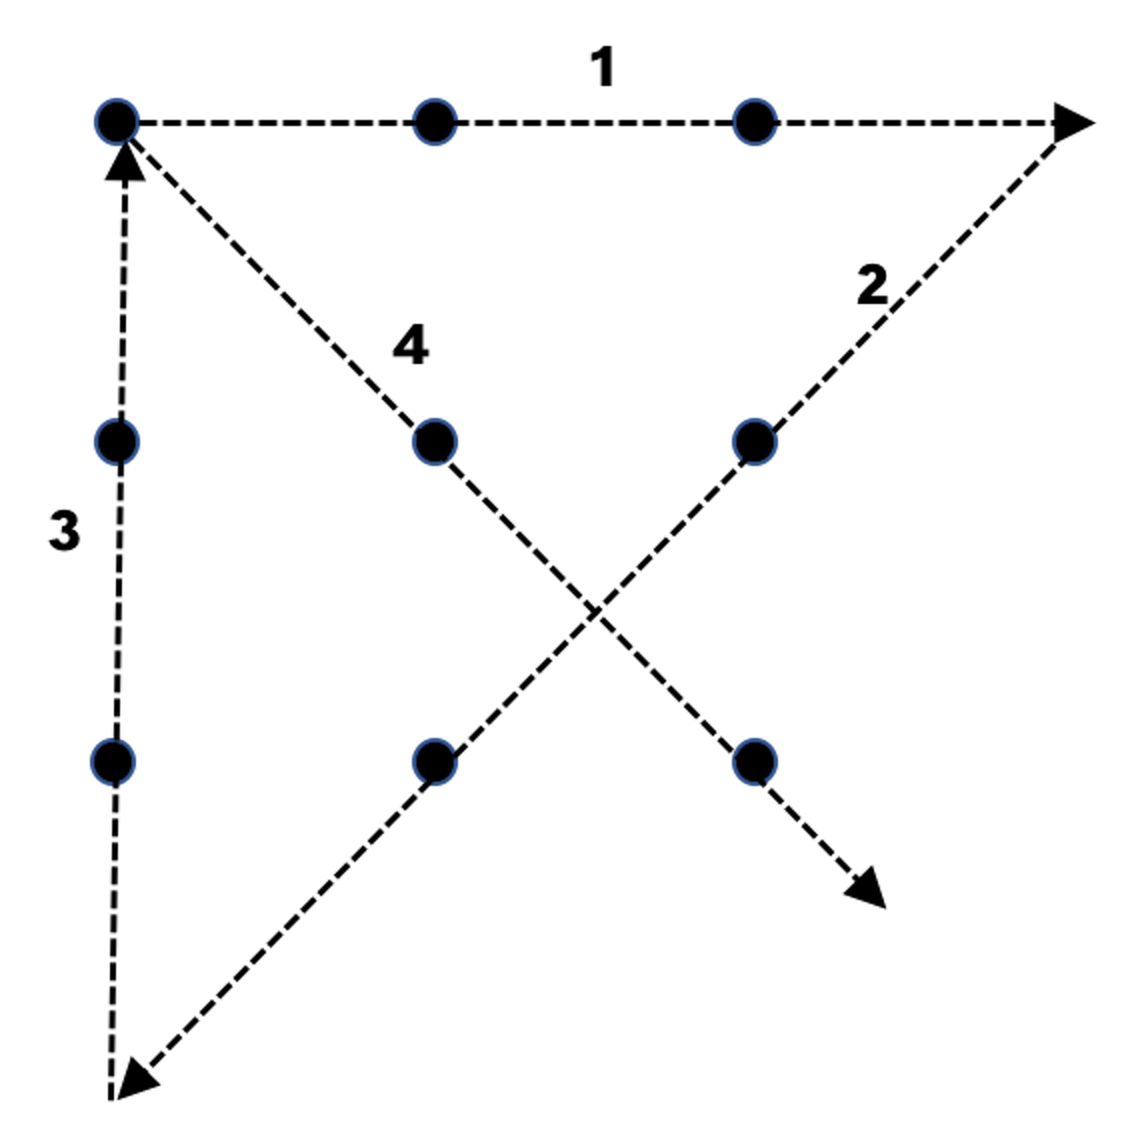
Readers, congratulations. The answer is illustrated in Figure 198.
Figure 198: The answer to connecting \(9\) points with \(4\) lines
